Analytics
The Analytics dashboard is available on the Professional and Unlimited plans. On the free plan, every feedback entry is still readable in full from your project in the dashboard.
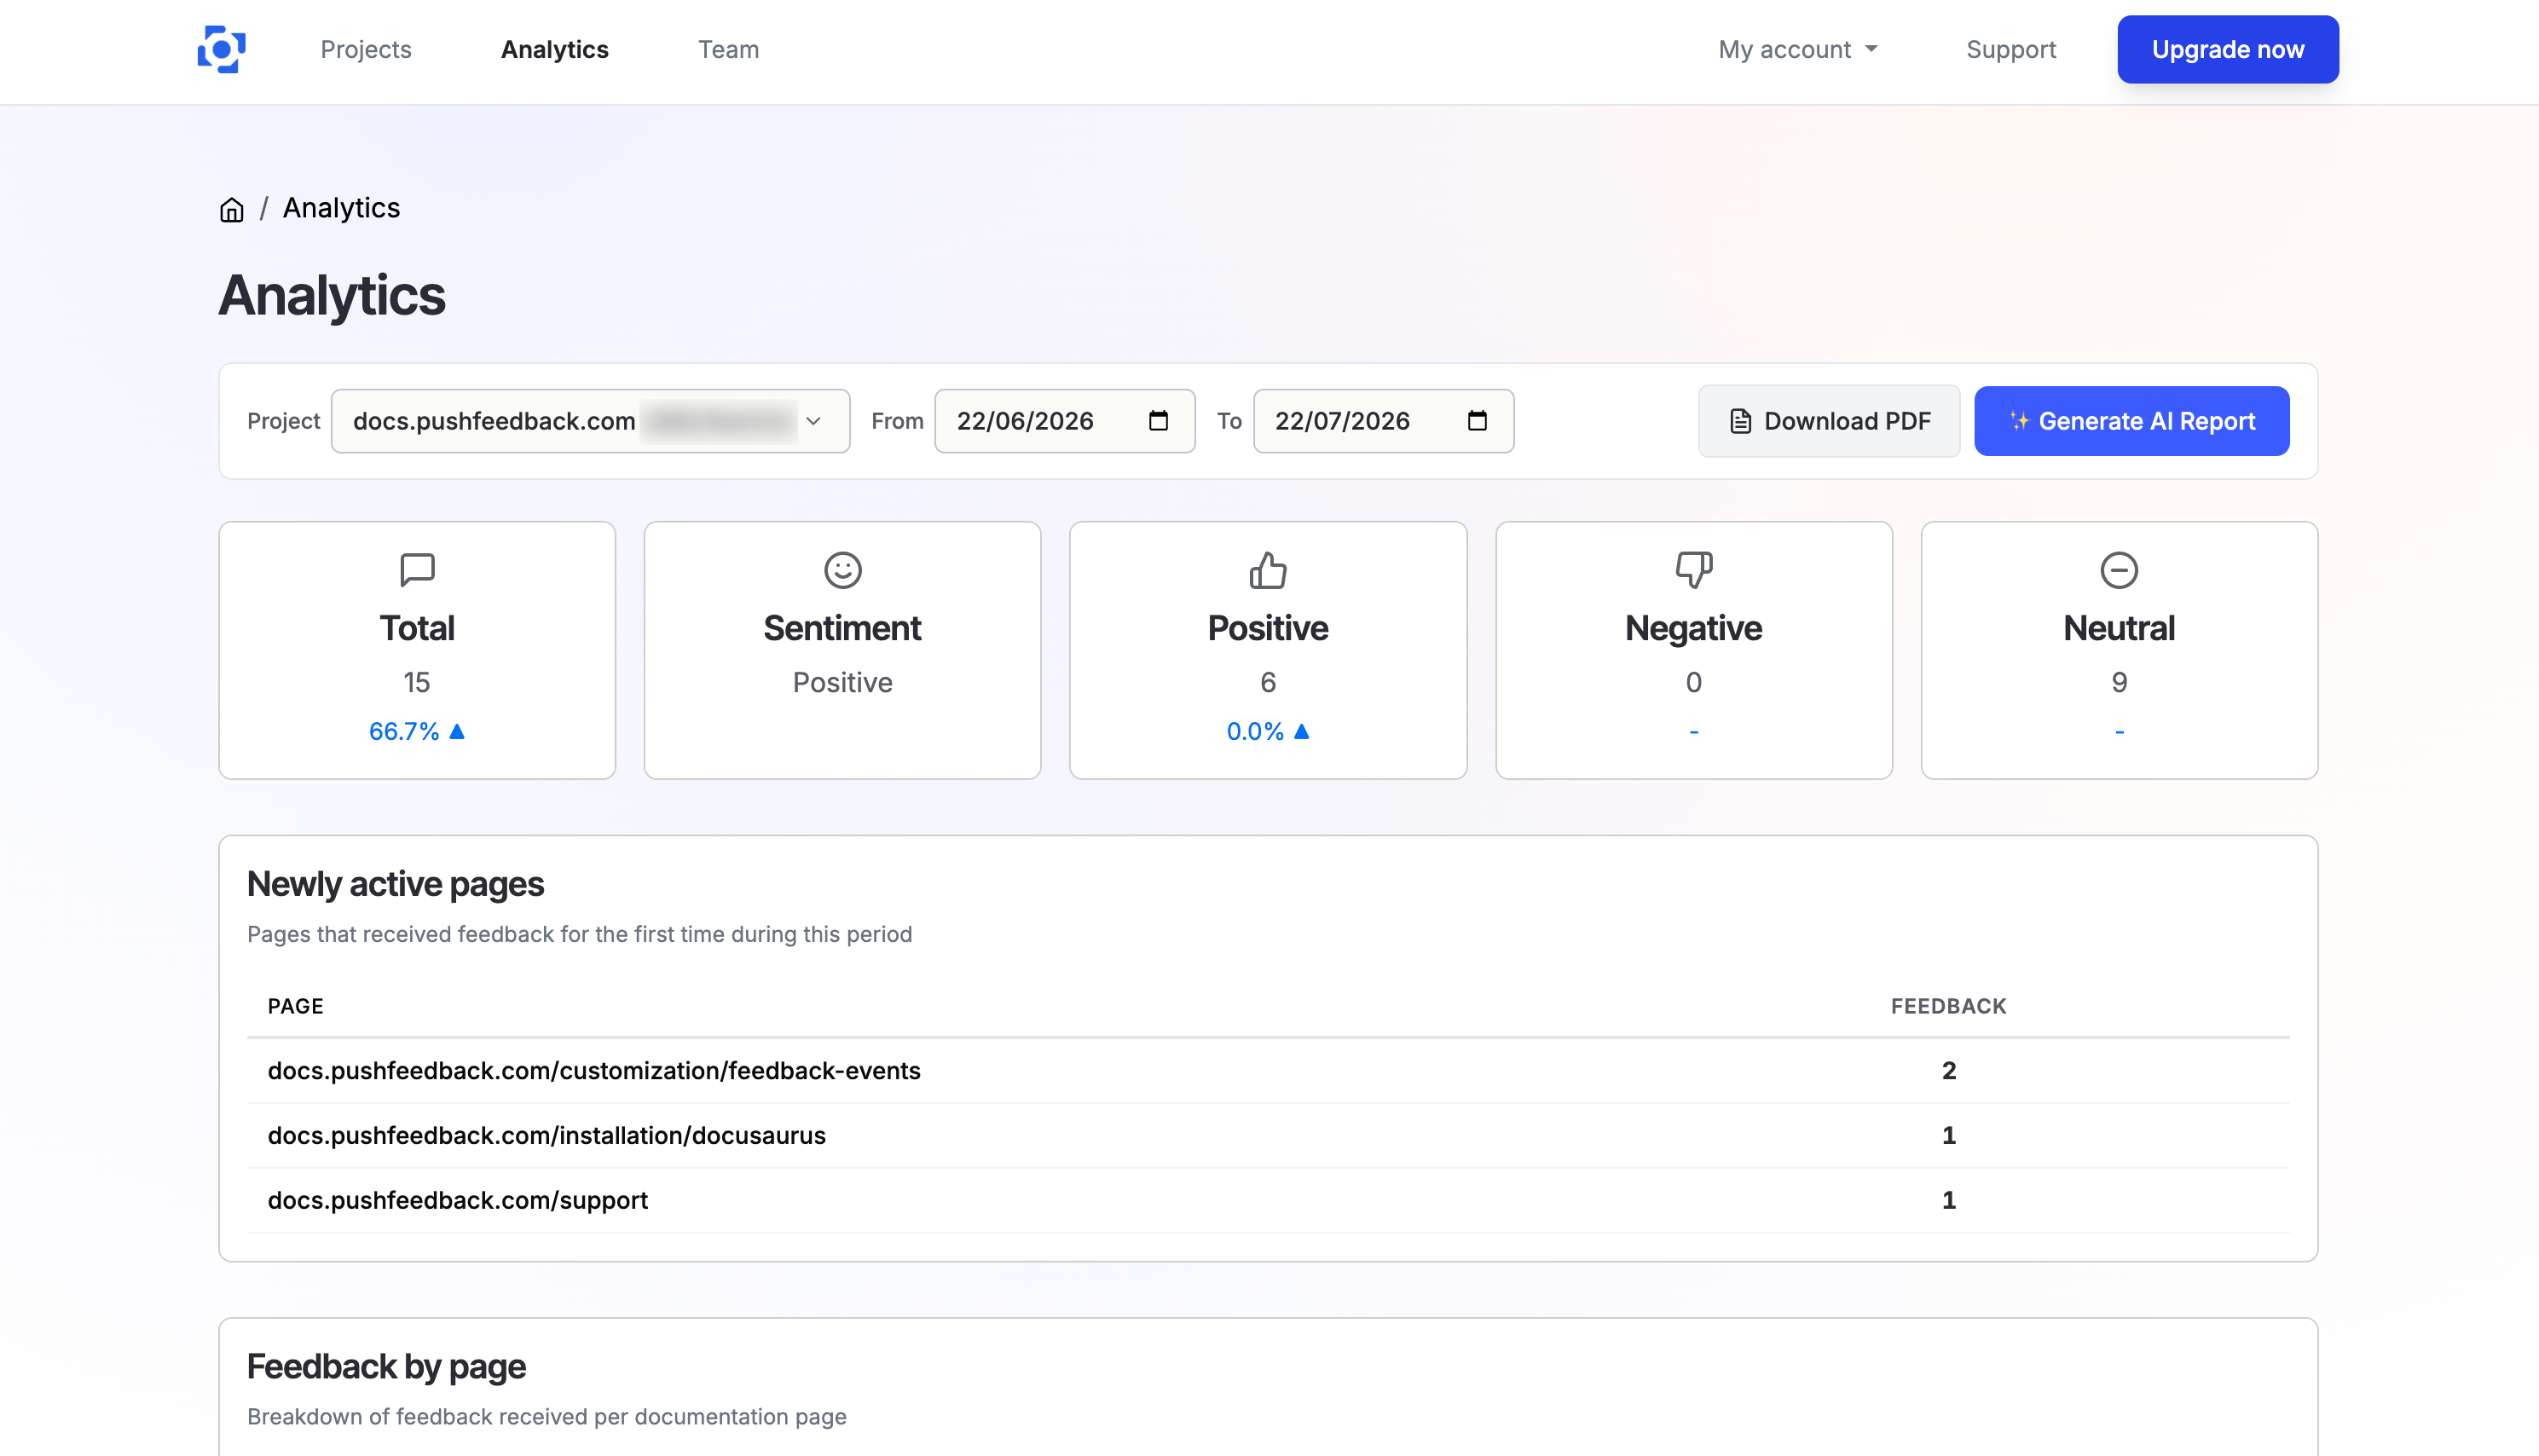
The Analytics dashboard gives you an overview of the feedback collected across your documentation pages. You can access it from the main navigation by clicking Analytics.
Filters
At the top of the dashboard, you can narrow down the data displayed using the following filters:
- Project: Select which project's feedback to view. If you have multiple projects, use the dropdown to switch between them.
- Start Date / End Date: Define the time range for the analytics. By default, the dashboard shows the last 30 days.
Changes to any filter are applied immediately.
KPI cards
Below the filters, five summary cards display high-level metrics for the selected period:
| Card | Description |
|---|---|
| Total | The total number of feedback items received. |
| Sentiment | The overall sentiment (Positive or Negative) based on whether positive + neutral feedback outweighs negative feedback. |
| Positive | The count of feedback items rated positively. |
| Negative | The count of feedback items rated negatively. |
| Neutral | The count of feedback items with no clear sentiment. |
Each card (except Sentiment) includes a growth indicator showing the percentage change compared to the previous period of the same length. An upward arrow indicates growth; a downward arrow indicates a decline.
Feedback by page
A table lists every page that received feedback during the selected period. For each page, you can see:
- Page: The URL of the page.
- Total: Total feedback count for that page.
- Positive / Negative / Neutral: Breakdown by sentiment.
- Status: Either Looking good (positive feedback exceeds negative) or Needs attention (negative feedback exceeds positive).
Results are paginated with 25 rows per page.
Newly active pages
If any pages received feedback for the first time during the selected period, they appear in the Newly active pages section. This helps you spot documentation pages that are starting to get user engagement. Each entry shows the page URL and the total number of feedback items.
Generate AI report
This feature is available on the Unlimited plan.
The Generate AI Report button produces an AI-powered summary of your feedback data.
When you click the button, the system analyzes up to 500 feedback items from the selected period and generates a report with three sections:
- Executive Summary: A brief overview of the feedback volume, overall sentiment, and the most notable finding.
- Most Requested Improvements: Up to 5 recurring themes extracted from the feedback, each with a description, mention count, sentiment label, and a representative user quote.
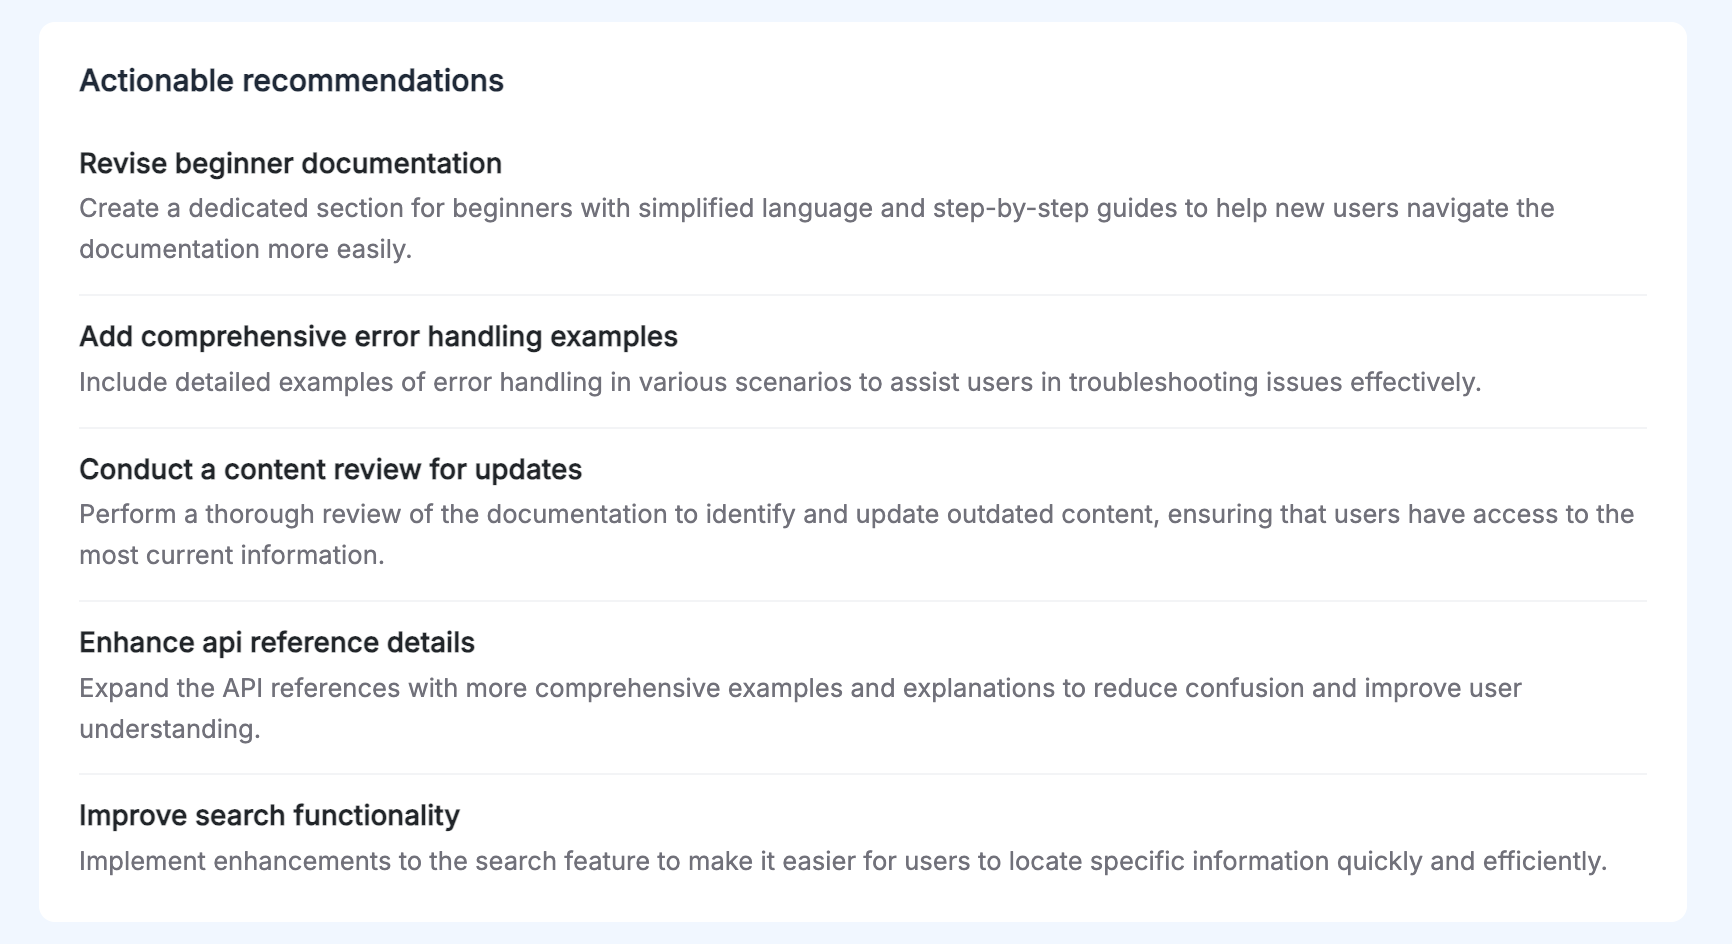
- Actionable Recommendations: 3-5 concrete suggestions for improving your documentation based on the feedback patterns.
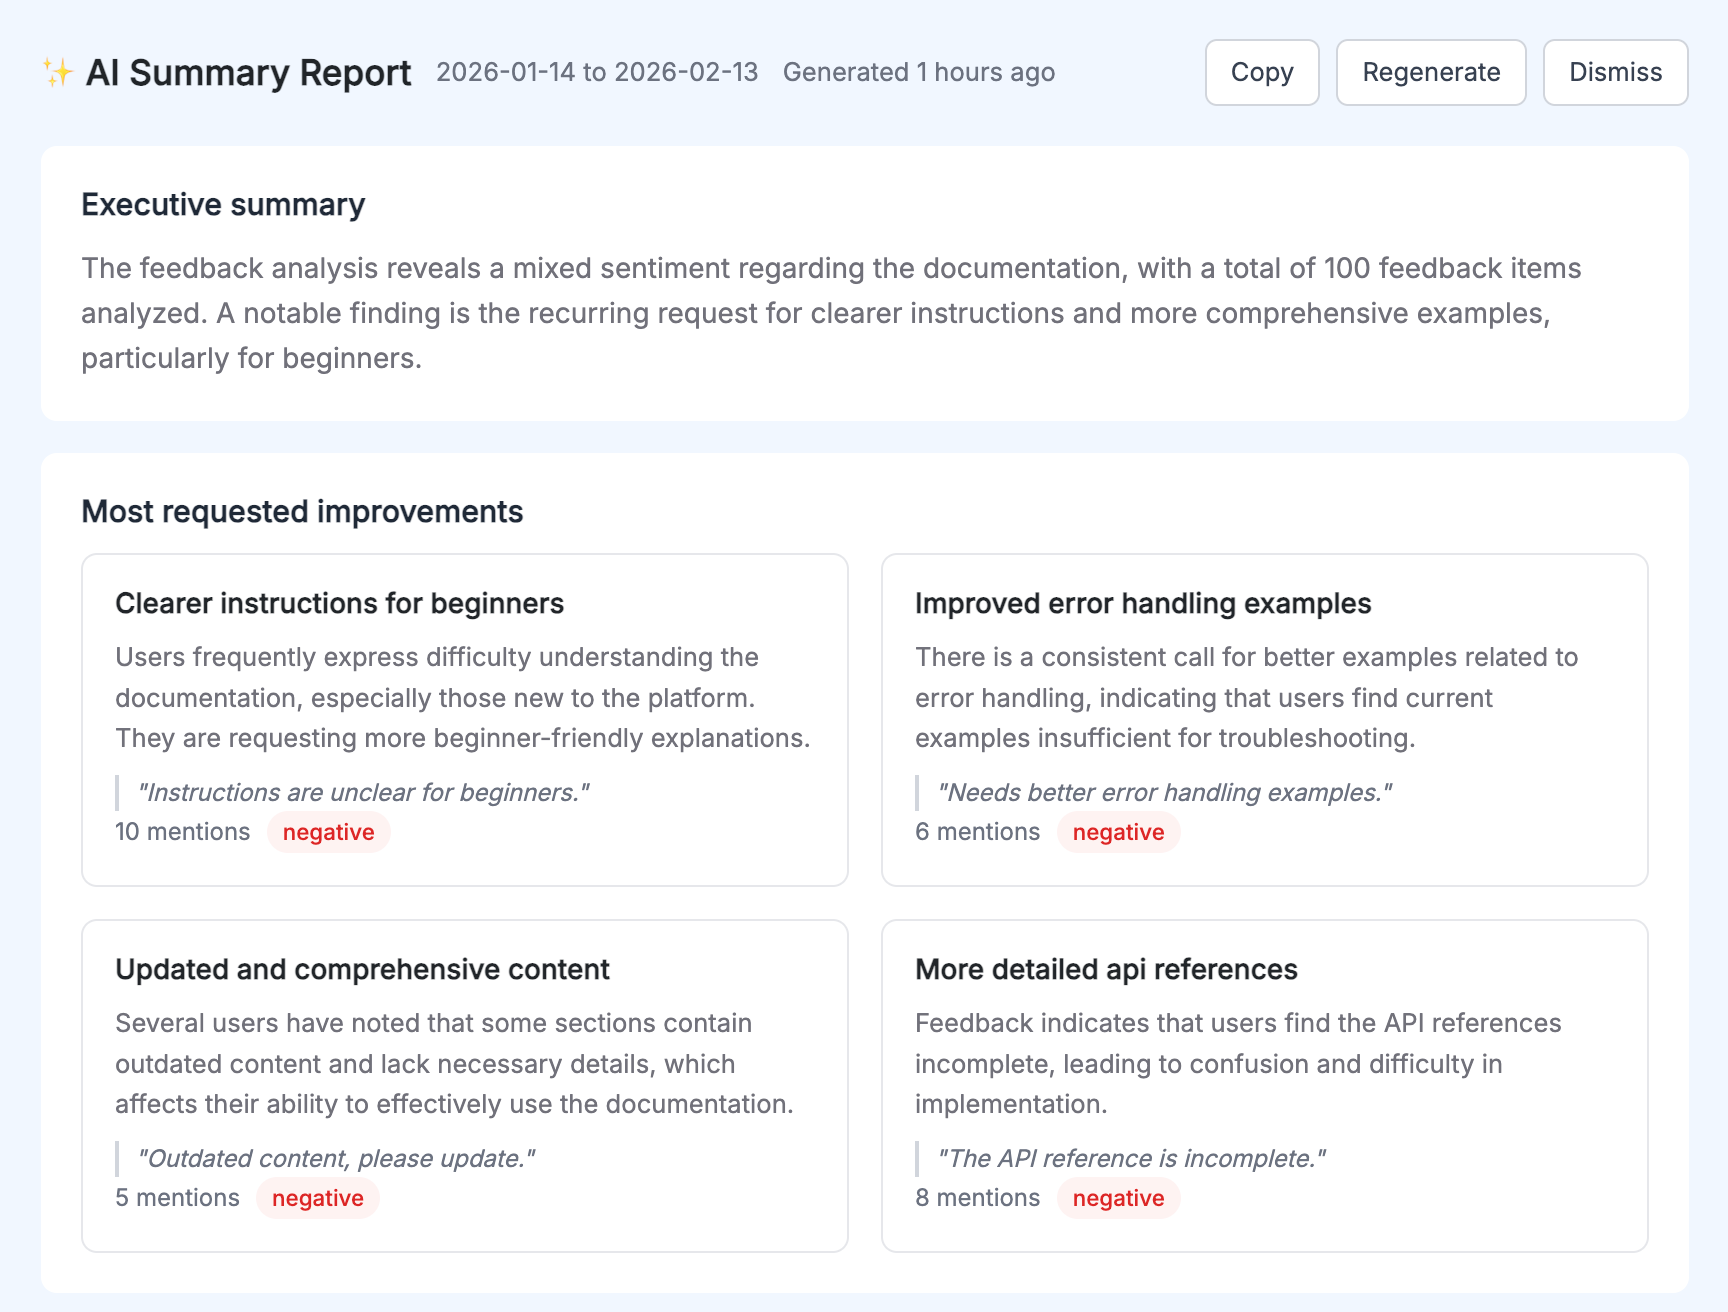
Once generated, you can:
- Copy the report text to your clipboard.
- Regenerate the report to get a fresh analysis.
- Dismiss the report to hide it from view.
Download PDF
Click the Download PDF button to save a printable version of the current dashboard view using your browser's print dialog.
Opting out of AI reports
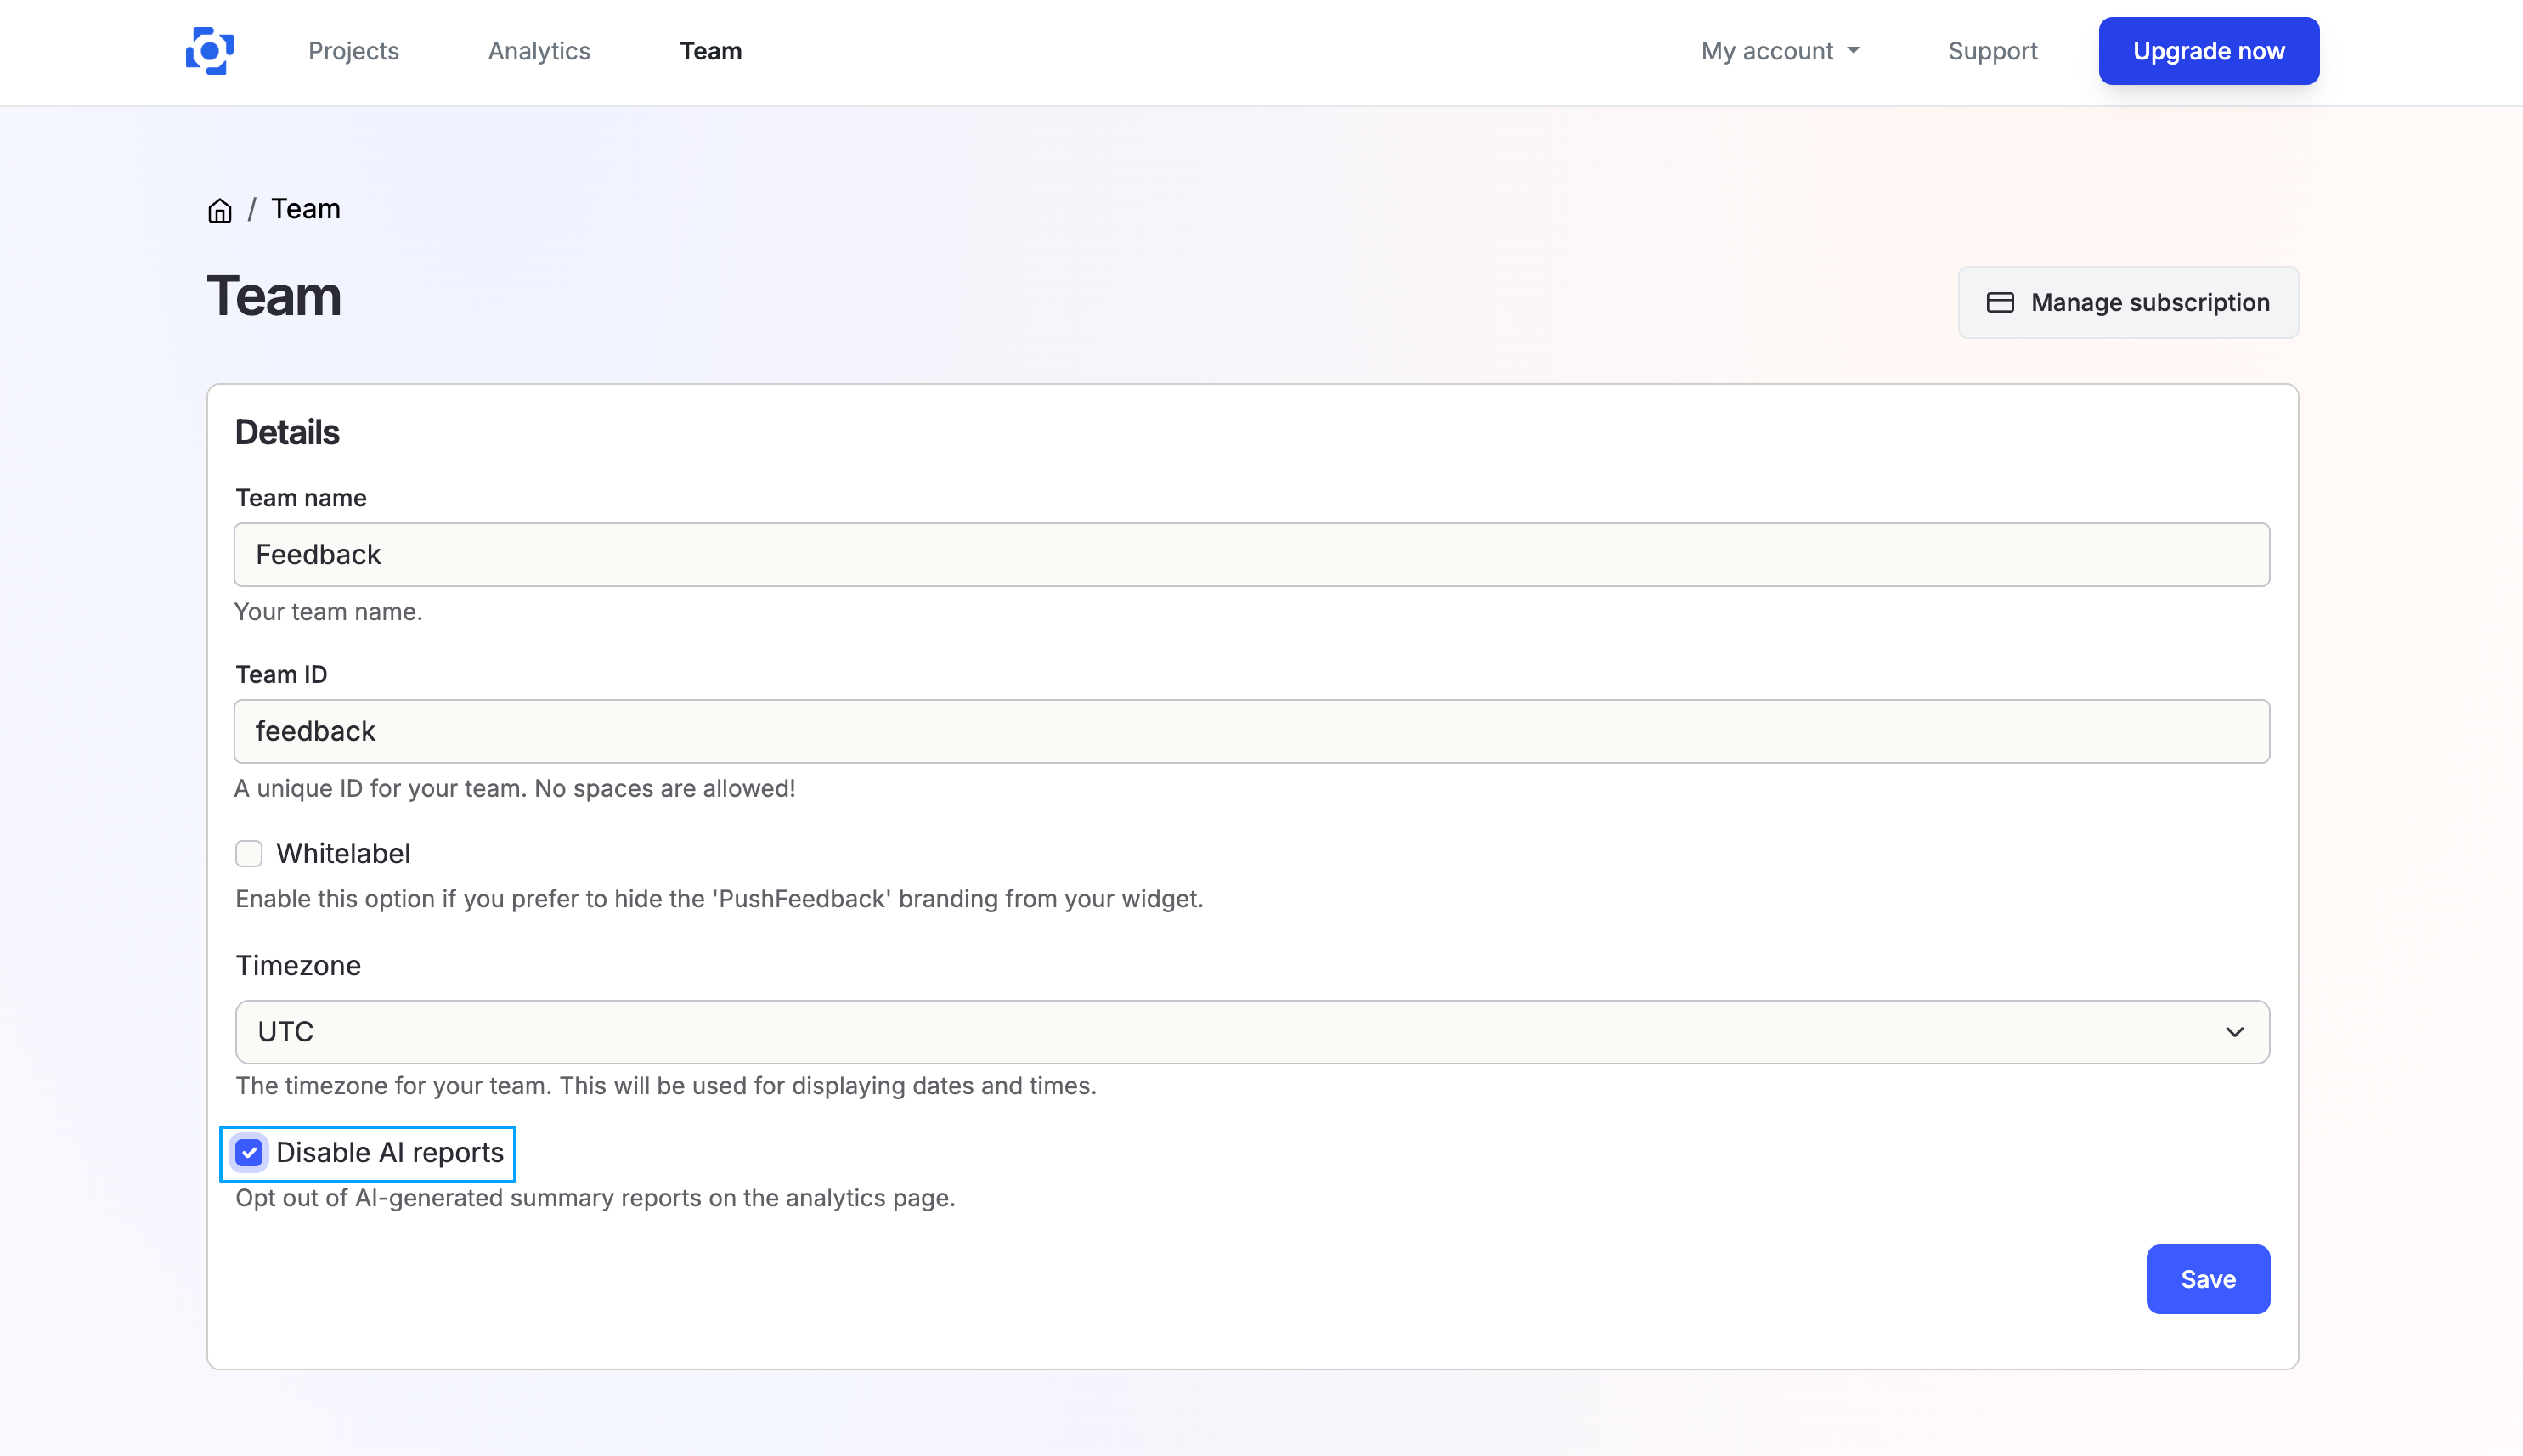
Team admins can disable the Generate AI Report feature for the entire team. When this option is enabled, the button is hidden from the dashboard and no team member can generate AI reports.
To opt out:
- Go to Team from the main navigation.
- In the Details section, check the Disable AI reports checkbox.
- Click Save.
To re-enable AI reports, uncheck the option and save again.